
Why use R?
Once you have mastered using Excel to build forecasting models, you may want to explore using other programming languages such as Python and R. Both Python and R have powerful libraries and packages for data analysis, modeling, and forecasting. Here are some benefits of using Python and R over Excel:
- Scalability: Python and R are more scalable than Excel, which means they can handle larger datasets and more complex models with greater ease. This can be especially important for organizations with large amounts of data and more advanced forecasting needs.
- Flexibility: Python and R offer more flexibility in terms of the types of models that can be built, and the methods used for data analysis and modeling. This allows data scientists to build more complex and sophisticated models and to explore new methods and techniques as needed.
- Reproducibility: Python and R both have features for version control and reproducibility, which means that models can be easily shared and replicated by others. This can be particularly important in collaborative projects and in scientific research.
- Automation: Python and R have libraries and packages for automating tasks, such as data cleaning, data preparation, and model evaluation. This can be especially useful for organizations with large amounts of data or frequent forecasting needs.
R specifically is a popular programming language and statistical software widely used for forecasting in businesses. Forecasting is an essential skill for businesses as it helps them anticipate future trends, plan for potential risks, and make informed decisions. By using R for forecasting, businesses can analyze large amounts of data, identify patterns and trends, and create accurate predictions for future outcomes.
R provides a wide range of packages and tools for forecasting, including forecast, fable, and ggplot2. These packages can help businesses build predictive models, visualize data, and make accurate forecasts. Additionally, R’s flexibility allows businesses to customize their forecasting models to meet their specific needs and goals.
Now that we have established the importance of forecasting in businesses and the role that R plays in this process, let’s dive deeper into how one can create a forecast using R. Forecasting with R involves several steps, including data cleaning, data visualization, model selection, and evaluation. These steps are crucial in building a reliable and accurate forecast model. In this response, we will explore these steps in detail to understand how to create a forecast using R.
Building a Forecast Model in R
Building a forecast model in R can be done in several steps:
- Load and Prepare the Data: The first step is to load the data into R and prepare it for use in the model. This may include importing the data from a file, transforming the data in some way, or aggregating the data to a higher level of granularity.
- Choose a Forecasting Method: The next step is to choose a forecasting method. R has several built-in packages for time-series analysis and forecasting, including the forecast and t series packages. There are also many other packages available for more specialized forecasting methods, such as exponential smoothing, ARIMA, and machine learning-based methods. We recommend exploring each of these packages and determining which package will meet your needs.
- Train the Model: Once a forecasting method has been chosen, the next step is to train the model. This involves fitting the model to the historical data, either by specifying the model parameters manually or by using an automated process.
- Validate the Model: After the model has been trained, it should be validated to ensure that it is accurate and suitable for the data. This may involve comparing the forecast results to actual data, adjusting the model parameters, or incorporating additional data sources.
- Make Forecasts: The final step is to use the model to make forecasts. This may involve generating a forecast for a single point in time or generating a complete forecast for a period of time. The results can be visualized using R’s built-in plotting functions, or by exporting the data to another tool for further analysis.
By following these steps, someone can build a forecast model using R that is tailored to their specific data and forecasting needs. R’s extensive library of packages and tools for time-series analysis and forecasting makes it a powerful tool for building accurate and reliable forecasting models.
Learn how to code the model
Here are some high level examples of how to get started.
First, you need to load the data into R using the read.csv() or read.table() function. Once you have the data loaded, you will need to perform some basic data cleaning, such as removing missing values or outliers.
After cleaning the data, the next step is to create a time series object. The ts() function in R can be used to create a time series object. The ts() function takes two arguments: the data and the frequency of the time series.
Once you have created the time series object, you can use R’s forecasting package to create a forecast. The forecast package provides several functions for forecasting, including auto.arima(), which automatically selects the best ARIMA model for the time series.
Here’s an example code for a basic forecast in R:
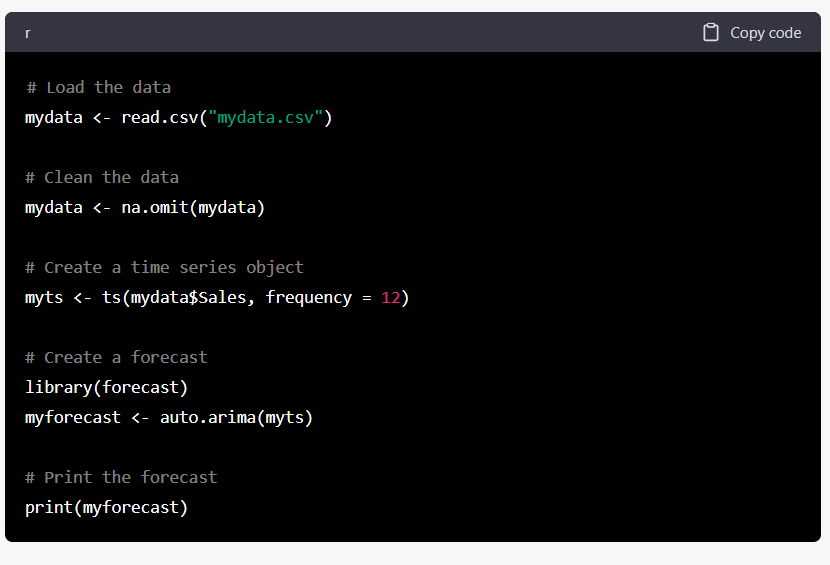
In this example, we assume that the data is in a CSV file called “mydata.csv” and contains a single column of sales data. We first load the data into R, clean the data by removing any missing values, create a time series object with a frequency of 12 (assuming monthly data), and create a forecast using the auto.arima() function from the forecast package. In the final step, we print the forecast object to see the model stats. You can further explore the model object to evaluate the fitted/predicted values of the model.
How to Enrich Your Forecast Further
The next step you can take is to enrich your forecast with external factors that could be impacting business (weather, economic conditions, etc.)
Using the data to wish to forecast, you can pass that data to the ready signal Auto Discovery function, and the Ready Signal application will test your data against all the data available in the catalog, and recommend features that are highly correlated to your business that you can test in your forecast model. You can learn more about this at Ready Signal.
All you need is an API key from Ready Signal. You can visit the Ready Signal website and sign up for an account to obtain the API key. Then using your “mydata” from the prior example, you can call the auto_discover() function from the readysignal library, pass your API Key/access token, your mydata as a dataframe, and define how the data is structured based on time and geographic granularity. This function will produce a signal_id specific to this data set and project.
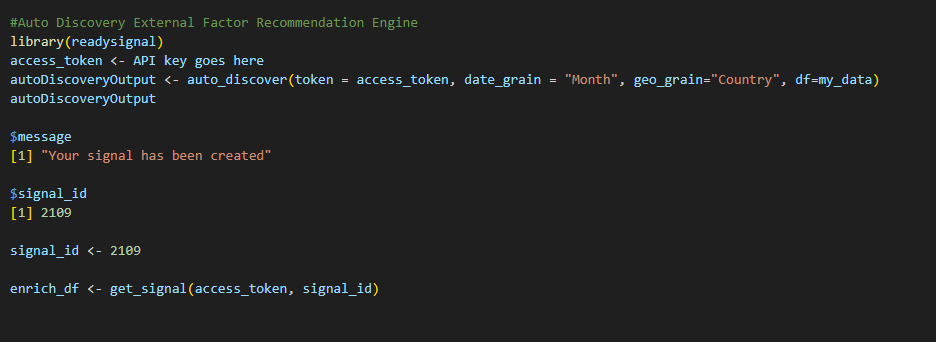
Once that signal_id is produced, you can then execute the get_signal() function, using that signal_id to return a data frame which includes up to 20 external features correlated to the target variable you are looking to forecast.
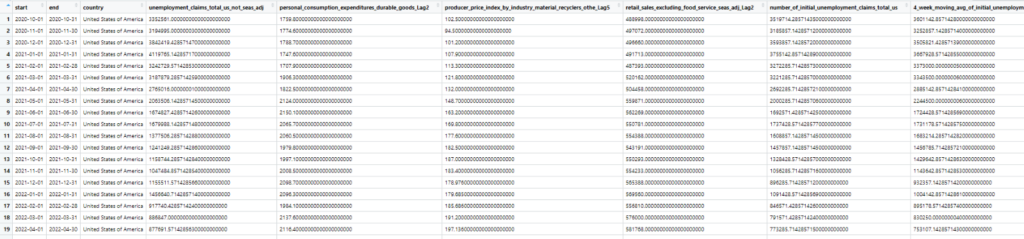
From here you can then join these external factors back to your data and begin testing these features in your forecast model.
Ready Signal offers a powerful platform for businesses to easily access, analyze, and forecast external data. With our intuitive interface and robust API, you can quickly integrate external data into your forecasting models and make data-driven decisions that drive business success. So why not sign up for a free account today and see for yourself how Ready Signal can help you take your forecasting to the next level? Visit our website at www.readysignal.com to learn more and get started.